
Positive Psychology
For Whom the Bell Holds
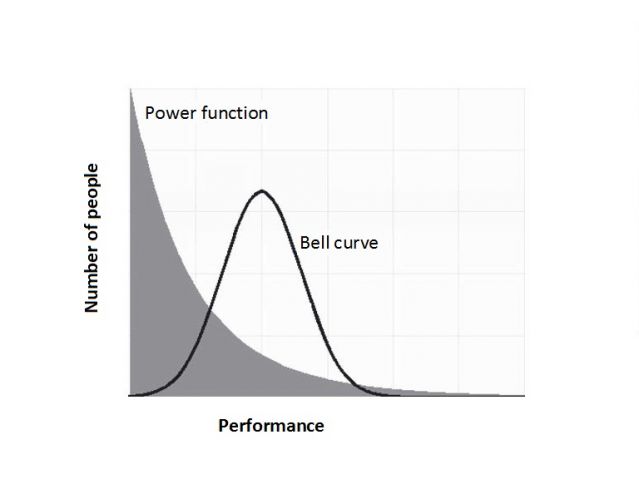
Performance distributions rarely fit a bell curve.
Posted May 31, 2012
I can only recognize the occurrence of the normal curve … as a very abnormal phenomenon. — Karl Pearson (1901)
Widely believed and rarely questioned is the notion that human characteristics, including in particular measures of performance, are distributed along a symmetric bell-shaped curve. There is a small handful of folks who score high and a comparable handful who score low, with most folks bunched together in the middle. Said another way, average scores are typical scores, and the number of extreme scores in one direction is about the same as the number of extreme scores in the other direction.
A recent article by Ernest O’Boyle and Herman Aguinus (2012) is therefore worthy of note, because it challenges the ubiquity of the bell-shaped curve as a description of human performance. These researchers looked at a large variety of objective performance measures from such domains as entertainment, science, politics, and sports and found that their distributions rarely fit a bell curve*.
And it was not just that the distributions were skewed or looked like a squished, dented, and/or stretched bell. Instead, most distributions had an altogether different shape, one technically described as a power function or a Paretian distribution, with many more extreme cases than would be expected were performance scores distributed in a bell-shaped fashion. Most people scored well below the arithmetic average, whereas a few scored well above.
For example, consider entertainers nominated for an Emmy Award. The typical nominee had but one nomination, and a notable minority of nominees accounted for the lion’s share of nominations. The good news is that there are superstar entertainers, and probably more than we might expect given our bell-shaped preconceptions. The less than good news is that most entertainers are below average. The same conclusions hold for other domains of human performance and — perhaps — for many other human characteristics as well**.
So what does it all mean?
First, as those of you who have taken a statistics course may remember, a bell-shaped curve is often described as a “normal” distribution, and the implication follows that other distributions are somehow abnormal. When we find that actual scores do not fit a bell shape, we suspect a problem with the sample or with the assessment of whatever characteristic is of interest but not with our assumptions about the population from which the sample is obtained.
Second, pointed-headily but importantly, the inferential statistics often used by social scientists to establish whether research results should be taken seriously or not are based on the assumption that “true” scores are distributed normally, i.e., in bell-shaped fashion. If this assumption is unwarranted, as it appears to be in many cases, then the conclusions based on the typical statistical tests may be wrong, resulting in false positives or false negatives, as the case may be***. Oh my.
Third, more generally and also importantly, the way we think about performance is challenged. Consider the grades we receive in school or the evaluations we receive at work. If those handing them out assume that performance is bell-shaped, then they may assign evaluations or grades accordingly, to fit the bell curve and not the reality.
Some “typical” students or workers may be inaccurately upgraded to average, whereas others doing quite well may be inaccurately downgraded to avoid assigning ostensibly inflated grades or evaluations, even though they may be appropriate. Indeed, in some schools or workplaces, a bell-shaped distribution may even be mandated by the powers-that-be, never mind what students or workers are actually doing. Oh my.
Fourth, we need to think differently about positive psychology. If a goal of positive psychology is to study people who do extremely well, then there may be more such people than we might expect. That’s good and makes positive psychology research easier to do because appropriate research participants are easier to find. However, if another goal of positive psychology people is to help “average” people to do better, it needs to be recognized that most people are below average. That’s bad because interventions, even those that “work” as intended, need to be reconceptualized. Once again, oh my.


So, the paper by O’Boyle and Aguinis has implications for theory, research, and practice. We should ask for whom the bell holds. With apologies to John Donne (and Ernest Hemingway), I conclude that it may not often hold for thee or for me.
* Why is the assumption of a bell-shaped curve so firmly established? It seems to describe rather well the distribution of certain biological characteristics — e.g., height or weight — as well as measures of human performance under highly-constrained circumstances—e.g., working on an assembly line or filling out a self-report survey. Moreover, bell-shaped curves have desirable mathematical properties and apparently captured the fancy of many early statisticians, who generalized their applicability beyond what was warranted.
** These are not exotic points. Most of us know that the “average” income in a workplace likely describes the pay of almost no one because lots of workers make very little, whereas some — those 1%-ers decried by the various occupy protests — make staggering amounts. And although families in a community may on “average” have 2.3 children, finding a family that fits that generalization is of course impossible, no matter how little we think of our neighbors' teenaged sons. The practical problem for society is when these points are not so obvious and policy decisions are then based on them.
*** How many erroneous conclusions based on violations of normality are established in the research literature is not clear, at least to me, although I assume (hope?) that there are relatively few. Within limits, many inferential tests assuming normal distributions are robust in the wake of violations. In any event, researchers should routinely look at the distributions of their measures and when indicated check conclusions based on statistical tests assuming normal distributions against conclusions based on other statistical tests that make no such assumptions.
Reference
O’Boyle Jr., E., & Aguinis, H. (2012). The best and the rest: Revisiting the norm of normality of individual performance. Personnel Psychology, 65, 79-119.

