Autism
From Autistic Linear Spectrum to Pie Chart Spectrum
Is it time to think of autism as a wheel, rather than a line?
Posted August 16, 2022 Reviewed by Devon Frye
Key points
- Thinking about autism spectrum disorder in a linear fashion can lead to unfair comparisons of experience.
- There is no "good" or "bad" autism, nor "easy" or "difficult" autism.
- Moving towards a pie-chart model could better encapsulate the diversity of experience within autism, researchers argue.
Even as a practitioner who works with autistic women, and as an autistic woman myself, understanding what exactly autism spectrum disorder is can be difficult. We tend to think of spectrums in terms of a linear progression—from high to low, moderate to severe, 1 to 10, or good to bad.
Indeed, ASD is currently categorised into levels 1, 2, and 3. Level 3 includes people who may have significant learning difficulties and includes non-verbal people; level 2 includes people who would struggle to live independently; and level 1 includes people of average or above average intelligence who have the capacity to live independent lives. The implication is that, as we move up through the spectrum from level 3 to level 1, people experience autism in less intense or impactful ways and that level 1 autism isn’t as “severe” as level 3 autism.
However, thinking about autism in this way is little comfort to many level 1 autistic people whose symptoms cause difficulties in almost every aspect of their lives. People with a level 1 autism diagnosis are more at risk than the general population of mental health problems, suicidality, career difficulties, bullying, and abuse.
One tool that practitioners have at their disposal, and that could help explain the autism spectrum in a non-linear way, is a pie chart, similar to the wheel of life used by some life coaches. The "pie chart" or "autism wheel" model is advocated by researchers who regard the linear model as static and limited. Bradshaw, et al. (2021), for example, note that "Using functioning labels and autism levels overlooks the real challenges and barriers of autistic people who may not outwardly appear different, and minimises the strengths, abilities, and capacities of those who do."
What the Autism Pie Chart Model Looks Like
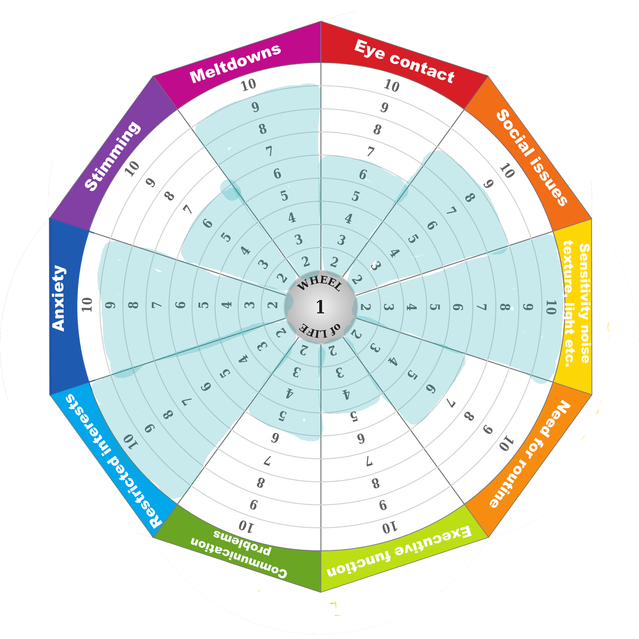
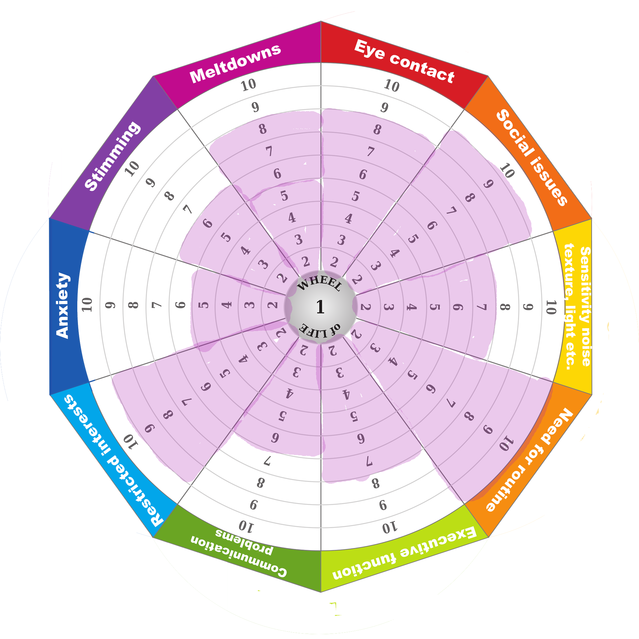
In the pie chart model, individual autism traits are represented by individual sections. It provides a visual representation of those autistic traits that someone might be higher in, compared to those they might experience in a lesser way.
For instance, someone might score 10 out of 10 in terms of anxiety or meltdowns, and 7 out of 10 in terms of sensory processing difficulties. Another person might score 10 out of 10 in terms of sensory processing, and 7 out of 10 in terms of anxiety or meltdowns.
Below are two examples from my clients, both diagnosed as autistic, who have very different experiences of autism. Neither is "more" or "less" autistic. Both are autistic.


Although the pie chart represents a simplified picture of autism and cannot include every trait, I argue that it shows very clearly that autism comes in all types of shapes and sizes, and that there’s no such thing as “easy” or “good” autism.
The pie chart model, or autism wheel, also acknowledges that autistic people's symptoms may change and develop through time, and allows for a fluid development over the life span.1 In a clear visual way, it allows us to see each autistic person in all their uniqueness and complexity.
For a blank version of the wheel, please visit my Facebook page (details under bio).
References
1. Bradshaw, P, Pickett, C. van Driel, M et al. (2021) ‘Autistic’ or ‘with autism’? Why the way general practitioners view and talk about autism matters, 50(3) doi: 10.31128/AJGP-11-20-5721


